


By Lynn Binnie
Whitewater Banner volunteer staff
whitewaterbanner@gmail.com
The Wisconsin Department of Public Instruction (DPI) on November 16 published school and district “accountability report cards” for the 2020-21 school year. Per DPI, the department is required by federal and state law to annually published accountability reports, but due to the COVID-19 pandemic, the reports were suspended for the 2019-20 school year. In releasing this year’s reports, DPI stated that it “urges using caution when interpreting scores and ratings” due to the pandemic.
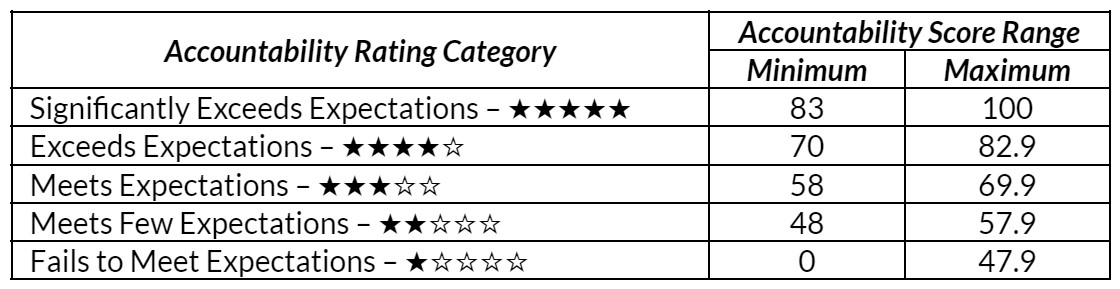
Report cards range from five stars, denoting schools and districts that significantly exceed expectations, to one star for those that fail to meet expectations. Of the 421 school districts that received report cards, 399 (95%) at least met expectations, and Whitewater Unified School District (WUSD) “met expectations.” Lakeview and Washington Elementary Schools “exceeded expectations,” receiving 4 stars, while the Middle School met “few expectations,” receiving 2 stars. Lincoln Elementary and the High School “met expectations.” 87% of the schools in the state that were ranked scored at least as meeting expectations.
Scores are calculated in four priority areas: achievement; growth; target group outcomes; and on-track to graduation. Per DPI, “By law, the larger the percentage of a school or district’s students who are economically disadvantaged, the more the growth measure contributes to its overall score. This allows schools and districts to be rewarded for advancing students’ progress regardless of their starting level.” The report cards shows WUSD as having 50.3% economically disadvantaged students.
Complete report cards for WUSD and its schools may be found here (click on green box and choose “Whitewater Unified” under “District.”)
District Superintendent Dr. Caroline Pate-Hefty provided the Banner with the following statement regarding the report cards, “In line with 95% of Wisconsin ranked schools, Whitewater Unified School District (WUSD), district report card received an overall accountability rating of ‘Meets Expectations.’ This is due to the exceptionally hard work our students and staff committed to, through a pandemic. From here, we will continue to push upwards and forward to meet the needs of our students. We have increased academic intervention services, are completing a program review of our language programs, have initiated birth-5 ‘Partners In Play’ programming with UWW and have been ranked by US News and World Reports as having the best elementary schools in the state of Wisconsin.” (The Banner article regarding “Best Elementary Schools” may be found here.)
The following measures are shown on the WUSD and individual school report cards.
| Measure | WUSD | Lake | Linc | Wash | Middle | High | K-12 state |
| Overall score | 62.8 *** | 75.0 **** | 61.1 *** | 80.1 **** | 55.3 ** | 67.9 *** | |
| Achievement | 58.0 | 81.9 | 54.6 | 73.1 | 52.7 | 53.9 | |
| Eng/Lang Arts | 59.7 | 78.4 | 53.9 | 72.0 | 56.8 | 55.7 | 61.4 |
| Math | 56.3 | 85.4 | 55.3 | 74.2 | 48.5 | 52.0 | 59.4 |
| Growth | 57.5 | 58.4 | 51.8 | 77.4 | 47.0 | 68.9 | |
| Eng/Lang Arts | 52.7 | 50.8 | 43.2 | 66.0 | 48.9 | 62.2 | 66.0 |
| Math | 62.2 | 66.0 | 60.3 | 88.8 | 45.1 | 75.5 | 66.0 |
| Target Group Outcomes | 50.9 | N/A | 54.2 | N/A | 40.2 | 57.8 | |
| Achievement | 19.9 | 22.0 | 14.4 | 13.9 | |||
| Growth | 55.6 | 53.7 | 44.2 | 67.0 | |||
| Chronic Absenteeism | 82.3 | 92.1 | 82.6 | 75.8 | |||
| Graduation | 89.8 | 92.0 | |||||
| Attendance | 95.7 | 94.5 | |||||
| On-Track to Graduation | 85.0 | 92.1 | 85.5 | 91.2 | 84.0 | 90.8 | |
| Chronic absenteeism | 90.0 | 93.8 | 91.0 | 95.0 | 90.4 | 85.2 | 87.0 |
| Graduation | 94.1 | 91.5 | |||||
| School wide attendance | 95.2 | 95.5 | 96.3 | 96.0 | 95.0 | ||
| 3rd grade Eng/Lang Arts | 67.0 | 82.4 | 54.3 | 73.6 | 58.9 | ||
| 8th grade Math | 47.0 | 47.3 | 55.3 |
DPI describes the four scores as follows:
- Achievement measures the level of knowledge and skills among students in the school, compared to state and national standards. It includes a composite of reading and mathematics performance by the “all students” group in the Wisconsin Student Assessment System (WSAS) for all tested grades in the school.
- Growth describes how much student knowledge of reading and mathematics in the school changes from year to year. It uses a point system that gives positive credit for students progressing toward higher performance levels, and negative credit for students declining below proficiency. This area focuses not on attainment, but the pace of improvement in student performance, no matter where students begin. All improvement is treated as a positive. Schools with high performance and little room to grow are not penalized.
- Target Group Outcomes demonstrates outcomes for students with the lowest test scores in their school – the Target Group. Outcomes are displayed for achievement, growth, chronic absenteeism, and attendance or graduation rate.
- On-Track to Graduation indicates the success of students in the school in achieving educational milestones that predict postsecondary success. It includes chronic-absenteeism and the graduation rate for schools that graduate students, or the attendance rate for other schools. It also includes measures of third-grade reading and eighth-grade mathematics achievement, as applicable to the school.


")


")


