


By Lynn Binnie
Whitewater Banner volunteer staff
whitewaterbanner@gmail.com
October 5, 2020
This very lengthy article provides the following information:
- The text of Gov. Evers’ cautionary radio address on October 1
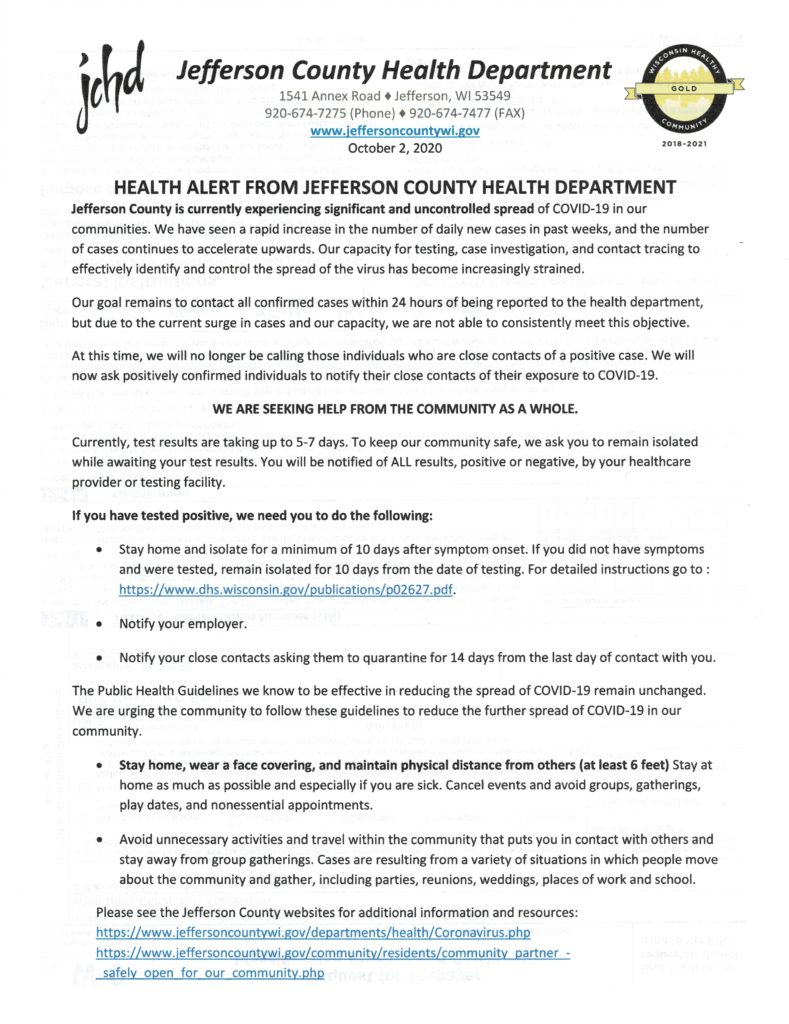
- A health alert from Jefferson County regarding a rapid increase in COVID-19 cases
- Updated data on case incidence and positivity in Walworth County and Whitewater. Walworth’s case incidence has significantly declined, in no small part due to declining cases at UW-W. However, with a 7-day case incidence of 25.9, the county is still considered to be “very high risk” under the Jefferson County model that WUSD is no longer using as guidance. Meanwhile, Jefferson County is currently reporting a 7-day case incidence rate of 36.8.
- WUSD’s current data, which indicates that since September 1 there have been nine positive cases among students and one staff member. In-person classes resumed fulltime for 4K – 5th grade on September 28; grades 6-12 are due to begin a hybrid model on October 12.
- UWWs current data, showing that last week there were only nineteen students and four staff with positive tests. In the previous four weeks there had been a total of 371 students and 15 others. No new positives were reported on October 5.
- Banner note: Per this state website, Rock and Walworth County both have “high” COVID activity levels, and Jefferson County has a “very high” level.
MADISON (Oct. 1) — Gov. Tony Evers today delivered the Democratic Radio Address encouraging Wisconsinites to take precautions to put the brakes on the pandemic and keep their family, friends, employees and co-workers, and neighbors safe.
Hi, folks. Governor Tony Evers here. We are seven months into the COVID-19 pandemic, and right now, it’s not slowing down—it’s actually picking up speed. That’s why I issued a new statewide face coverings order to help us try and contain this virus and stop the spread. But folks, if we are going to get this virus under control, then wearing a mask is the absolute least we need you to do. We have got to put the brakes on this pandemic to keep our friends, family, employees and co-workers, and neighbors safe so that we can get through this pandemic together.
And yes, it starts by wearing a mask whenever you are out and about, but we also need folks to understand that wearing a mask is not a substitute for social distancing. If you are planning to host a backyard barbeque with your extended family or a group of friends, please reconsider. If you are planning an event for your community or organization, please host it virtually. If you want to get out and support a local restaurant, enjoy it outside while wearing a mask or grab it to go. Skip the play dates, dinner parties, family get-togethers, and work conferences, or any other gatherings with people you don’t live with for the time being. And of course, wear a mask whenever you are around others who are not members of your household.
This virus is real and is devastating our communities and will continue to do so until we all get on the same team.
Let’s get through this together, Wisconsin, by staying apart. Thank you.
DAILY CASE INCIDENCE PER 100,000 PEOPLE – WALWORTH COUNTY
| End Date | New cases/14 days | Incidence | New cases/7 days | Incidence |
| 9/15 | 527 | 38.8 | 403 | 59.2 |
| 9/22 | 648 | 47.7 | 245 | 36 |
| 9/29 | 379 | 27.9 | 134 | 19.7 |
| 10/5 | 302 | 22.2 | 176 | 25.9 |
DAILY CASE INCIDENCE PER 100,00 PEOPLE – CITY OF WHITEWATER (WALWORTH COUNTY PORTION)
| End Date | New cases/14 days | Incidence | New cases/7 days | Incidence |
| 9/15 | 345 | 206.8 | 284 | 340.4 |
| 9/22 | 419 | 251.1 | 132 | 158.1 |
| 9/29 | 180 | 107.9 | 48 | 57.6 |
| 10/5 | 60 | 35.9 | 7 | 8.43* |
TEST POSITIVITY RESULTS – CITY OF WHITEWATER (WALWORTH COUNTY PORTION)
| End Date | # Tests Reported – 14 days | # Positive | Positivity % | # Tests Reported – 7 days | #Positive | Positivity % |
| 8/22 | 216 | 27 | 12.5% | 103 | 6 | 5.8% |
| 8/29 | 240 | 19 | 7.9% | 128 | 13 | 9.2% |
| 9/7 | 421 | 77 | 18.3% | 274 | 60 | 21.9% |
| 9/20 | 958 | 404 | 42.2% | 571 | 204 | 35.7% |
| 9/29 | 663 | 180 | 27.1% | 236 | 48 | 20.3% |
| 10/5 | 379 | 60 | 15.8% | 115 | 7 | 6.1%* |
TEST POSITIVITY RESULTS – WALWORTH COUNTY
| End Date | # Tests Reported – 14 days | #Positive | Positivity % | # Tests Reported – 7 days | # Positive | Positivity % | % of Those with Positive Results Who Reported being Asymptomatic | Total Deaths |
| 8/22 | 2386 | 277 | 11.6% | 1071 | 112 | 10.5% | 11.4% | 25 |
| 8/29 | 1972 | 210 | 10.6% | 901 | 98 | 10.9% | 11.1% | 27 |
| 9/7 | 1953 | 228 | 11.7% | 986 | 129 | 13.1% | 10.9% | 32 |
| 9/22 | 2689 | 648 | 24.1% | 1249 | 245 | 19.6% | 9.7% | 34 |
| 9/29 | 2504 | 379 | 15.1% | 1255 | 134 | 10.7% | 9.75% | 35 |
| 10/5 | 2189 | 302 | 13.8% | 864 | 176 | 25.6% | ? | 35 |
WUSD is providing the following “COVID Tracking Data” on its website at this link.
COVID TRACKING DATA
On September 23, 2020 the WUSD School Board voted to suspend the utilization of a community level metric.
Below is the cumulative and daily average of close contact, symptomatic, COVID positive staff and students.
| COVID Tracking Data | Cumulative | Daily Average |
| Number of Close Contact Staff | 16 | 3 |
| Number of Symptomatic Staff | 17 | 1 |
| Number of (+) Staff | 1 | 1 |
| Number of Staff Quarantined in total since Sept 1 (sum of above) | 34 | |
| Number of Close Contact Students | 41 | 14 |
| Number of Symptomatic Students | 38 | 11 |
| Number of (+) Students | 9 | 6 |
| Number of Students Quarantined in total since Sept 1 (sum of above) | 88 | |
| Total Number of Positive COVID Cases | 10 | 7 |
| Number of Days of School | 22 | |
| Data from September 30 Updated 10/1/2020 | ||
UWW has established the following dashboard which provides useful information. It is found at this link.
COVID-19 Dashboard
The COVID-19 pandemic is an ever-changing situation and the University of Wisconsin-Whitewater actively monitors and reviews a series of health, safety, and resource metrics to guide decision-making with regard to university operations. These metrics are considered in combination and consultation with recommendations and orders from the state and county health departments before any changes in operations are made.
Last Updated 10/5/2020 at 8:25 PM
COVID-19 cases reported to UW-Whitewater
| New reports – Week of Oct. 4 – Oct. 10 | Previous week | Cumulative reports since March 2020 | |
| Students | 0 | 19 | 393 |
| Employees | 0 | 4 | 15 |
| Other | 0 | 0 | 3 |
| Unknown | 0 | 0 | 1 |
Dashboard is updated on business days with available data. Numbers include cases reported through university-coordinated testing, as well as those reported through the COVID-19 Hotline, which may include testing that occurred off-campus through other health clinics/providers. Student employees are counted in the student numbers. The “Other” category is defined as any positive cases reported to UW-Whitewater who are neither students nor employees and may include visitors to the university, contractors or vendors, or others who have been to the university in person. These numbers represent individuals who have had direct contact with the campuses. Individuals who are working or attending solely in a remote manner and not living in University Housing are not included.
Regional Metrics
| University Health and Counseling Services (9/17-10/2) | Walworth County (9/16-9/29) | Rock County (9/16-9/29) | Jefferson County | Wisconsin (7-day average) | |
| Percent Positive | 30% (74/244*) | 11.54% | 13.13% | 19.2% | 17.1% |
| Time to complete contact tracing | 100% of contacts are initiated within 48 hours** | 84% of contacts are initiated within 48 hours | 35% of contacts are initiated within 48 hours | Not Available | N/A |
| Healthcare system capacity level | No crisis management of care | No crisis management of care | No crisis management of care | Not Available | 19% Available (Based on Immediate Bed Availability) |
| Total cases per 100,000 | n/a | 338.2 | 329.5 | 474.8 | 511.4 |
*UHCS percentage positive is based on PCR testing performed at the University Clinic site of students only. Case totals are represented by (Total Positives/Total PCR Tests)
**To avoid duplication, UHCS actively partners with Walworth, Rock, and Jefferson Health Departments. County Health Departments do tracing of positive cases and UHCS employees do tracing of contact cases.
Previous 7 days of PCR Tests Administered
| PCR* Test Date | # of PCR Tests Administered |
| 9/24/20 | 8 |
| 9/25/20 | 11 |
| 9/28/20 | 6 |
| 9/29/20 | 4 |
| 9/30/20 | 12 |
| 10/1/20 | 7 |
| 10/2/20 | 11 |
*PCR testing is conducted on symptomatic individuals and individuals with positive Antigen testing results.
| Total All PCR Tests | # of PCR Negative | # of PCR Positive | Percentage Positive |
| 849 | 638 | 228 | 26.3% |
Previous 7 days of Antigen Testing Administered
| Antigen* Test Date | # of Antigen Tests Administered | # of Antigen Negative Results | # of Antigen Positive Results | Percentage Positive |
| 9/24/20 | 26 | 26 | 0 | 0.0% |
| 9/25/20 | 101 | 101 | 0 | 0.0% |
| 9/28/20 | 73 | 71 | 2 | 2.8% |
| 9/29/20 | 101 | 100 | 1 | 1.0% |
| 9/30/20 | 93 | 89 | 4 | 4.5% |
| 10/1/20 | 78 | 78 | 0 | 0.0% |
| 10/2/20 | 86 | 85 | 1 | 1.2% |
| Total All Antigen Tests | 1,419 | 1,370 | 49 | 3.6% |
*Antigen testing is conducted on asymptomatic and random volunteers.


")


")


